Edit chart
Loading graph
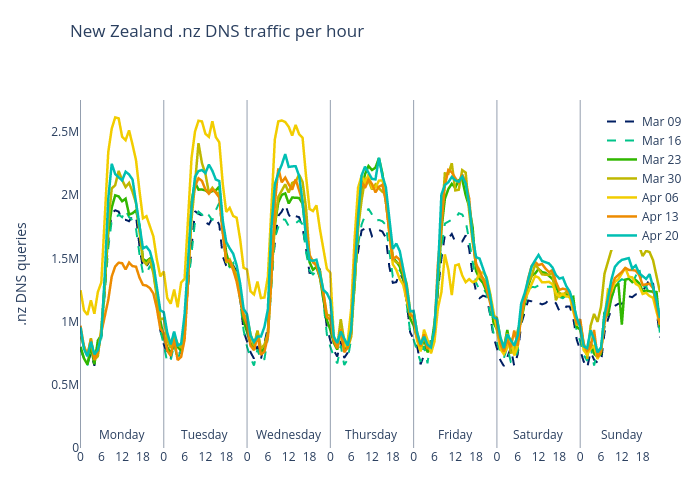
Sebcastro's interactive graph and data of "New Zealand .nz DNS traffic per hour" is a line chart, showing Mar 09, Mar 16, Mar 23, Mar 30, Apr 06, Apr 13, Apr 20; with .nz DNS queries in the y-axis. The x-axis shows values from 0 to 0. The y-axis shows values from 0 to 0. This visualization has the following annotations: Monday; Tuesday; Wednesday; Thursday; Friday; Saturday; Sunday