Edit chart
Loading graph
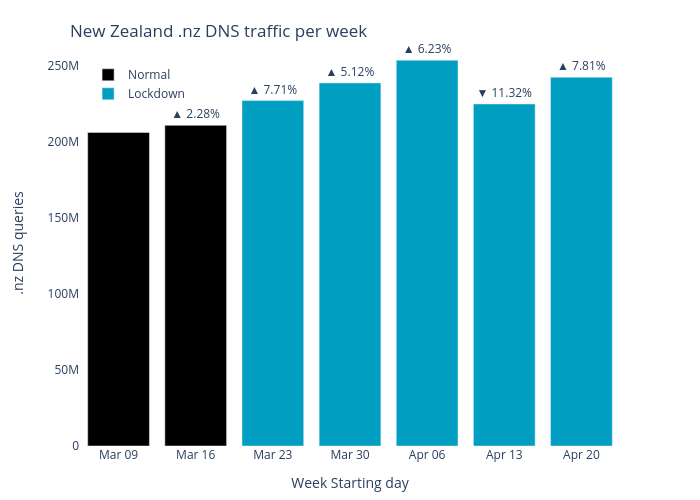
Sebcastro's interactive graph and data of "New Zealand .nz DNS traffic per week" is a bar chart, showing Normal vs Lockdown; with Week Starting day in the x-axis and .nz DNS queries in the y-axis.. The x-axis shows values from 0 to 0. The y-axis shows values from 0 to 0.