Edit chart
Loading graph
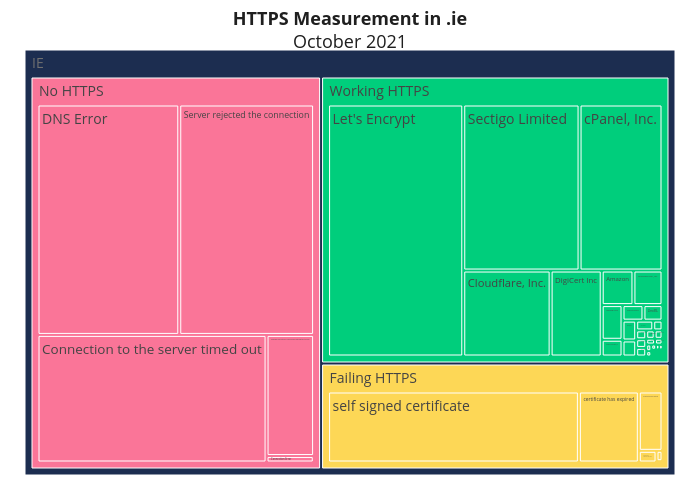
Sebcastro's interactive graph and data of "HTTPS Measurement in .ieOctober 2021" is a treemap. The x-axis shows values from 0 to 0. The y-axis shows values from 0 to 0.