Edit chart
Loading graph
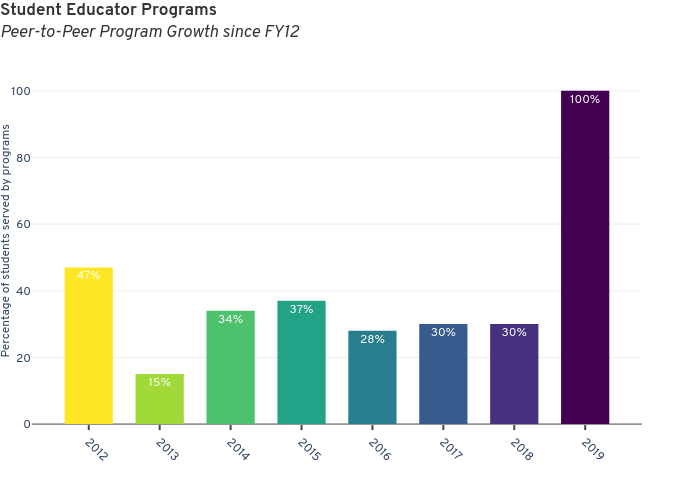
Seb382's interactive graph and data of "Student Educator ProgramsPeer-to-Peer Program Growth since FY12" is a bar chart, showing ; with in the x-axis and Percentage of students served by programs in the y-axis.. The x-axis shows values from 2011.2 to 2019.8. The y-axis shows values from 0 to 110. This visualization has the following annotation: Positive numbers indicate an increase in net emissions since reporting began