Edit chart
Loading graph
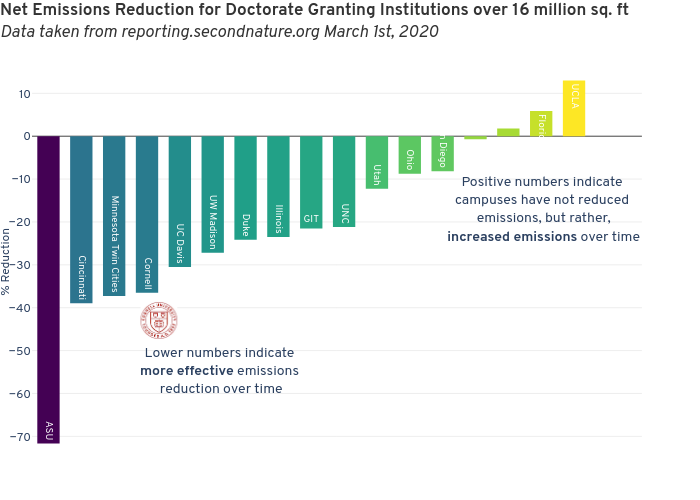
Seb382's interactive graph and data of "Net Emissions Reduction for Doctorate Granting Institutions over 16 million sq. ftData taken from reporting.secondnature.org March 1st, 2020" is a bar chart, showing Change in Net Emissions since reporting began; with in the x-axis and % Reduction in the y-axis.. The x-axis shows values from -0.5 to 17.771019914786464. The y-axis shows values from -76.35388888888889 to 17.723888888888887. This visualization has the following annotations: Positive numbers indicatecampuses have not reduced emissions, but rather, increased emissions over time; Lower numbers indicatemore effective emissions reduction over time