Edit chart
Loading graph
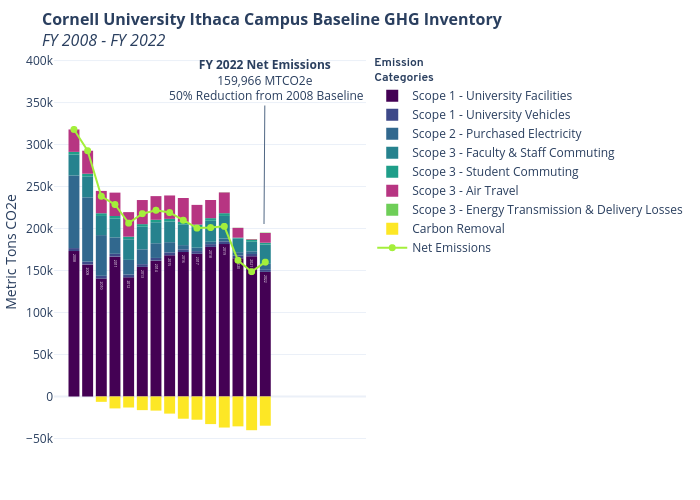
Seb382's interactive graph and data of "Cornell University Ithaca Campus Baseline GHG InventoryFY 2008 - FY 2022" is a , showing Scope 1 - University Facilities, Scope 1 - University Vehicles, Scope 2 - Purchased Electricity, Scope 3 - Faculty & Staff Commuting, Scope 3 - Student Commuting, Scope 3 - Air Travel, Scope 3 - Energy Transmission & Delivery Losses, Carbon Removal, Net Emissions; with Metric Tons CO2e in the y-axis. The x-axis shows values from 2007.1048935785336 to 2023.5745243054696. The y-axis shows values from -60167.32953509108 to 340699.2611667305. This visualization has the following annotation: FY 2022 Net Emissions159,966 MTCO2e 50% Reduction from 2008 Baseline