Edit chart
Loading graph
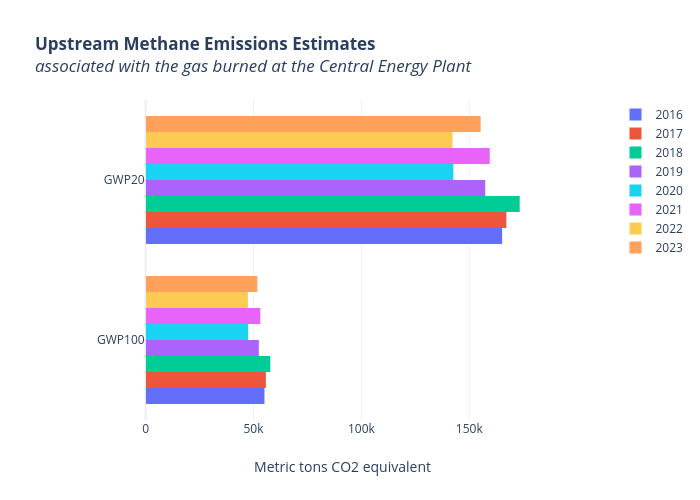
Seb382's interactive graph and data of "Upstream Methane Emissions Estimatesassociated with the gas burned at the Central Energy Plant" is a grouped bar chart, showing 2016, 2017, 2018, 2019, 2020, 2021, 2022, 2023; with Metric tons CO2 equivalent in the x-axis. The x-axis shows values from 0 to 182494.73684210525. The y-axis shows values from -0.5 to 1.5.