Edit chart
Loading graph
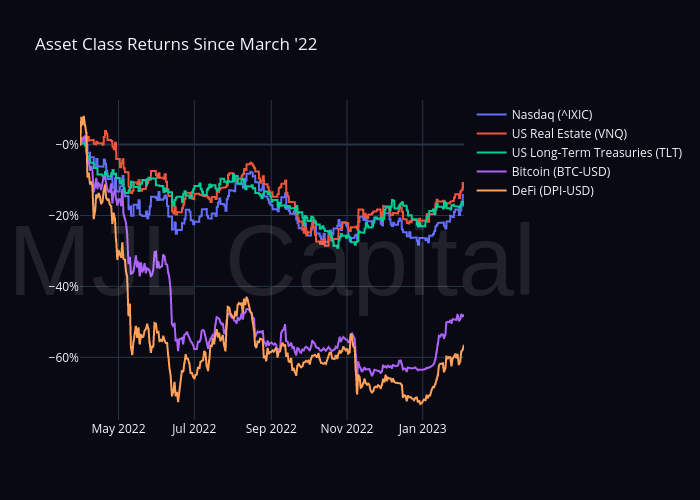
Sean_mjl's interactive graph and data of "Asset Class Returns Since March '22" is a scatter chart, showing Nasdaq (^IXIC), US Real Estate (VNQ), US Long-Term Treasuries (TLT), Bitcoin (BTC-USD), DeFi (DPI-USD). The x-axis shows values from 0 to 0. The y-axis shows values from 0 to 0. This visualization has the following annotation: MJL Capital