Edit chart
Loading graph
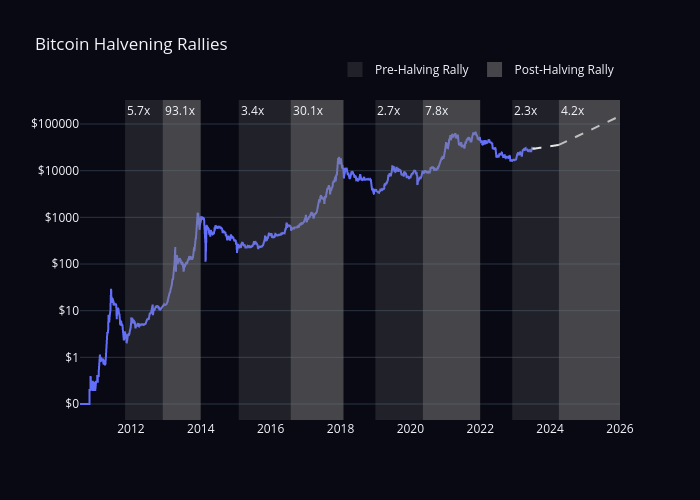
Sean_mjl's interactive graph and data of "Bitcoin Halvening Rallies" is a line chart, showing Pre-Halving Rally vs Post-Halving Rally. The x-axis shows values from 0 to 0. The y-axis shows values from 0 to 0. This visualization has the following annotations: 5.7x; 3.4x; 2.7x; 2.3x; 93.1x; 30.1x; 7.8x; 4.2x