Edit chart
Loading graph
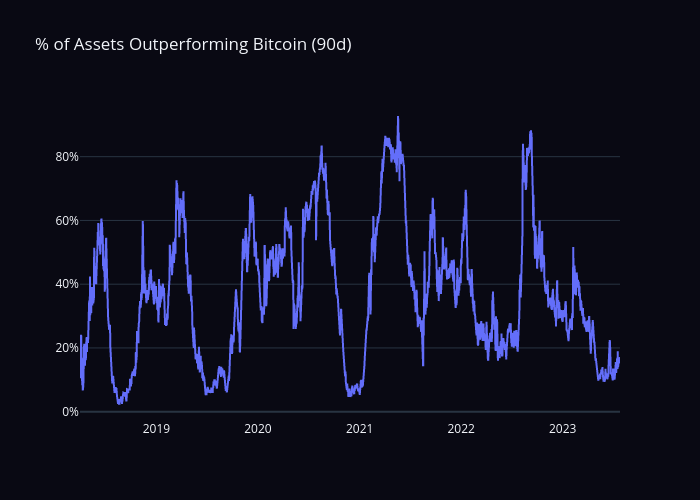
Sean_mjl's interactive graph and data of "% of Assets Outperforming Bitcoin (90d)" is a line chart, showing TVL. The x-axis shows values from 0 to 0. The y-axis shows values from 0 to 0.