Edit chart
Loading graph
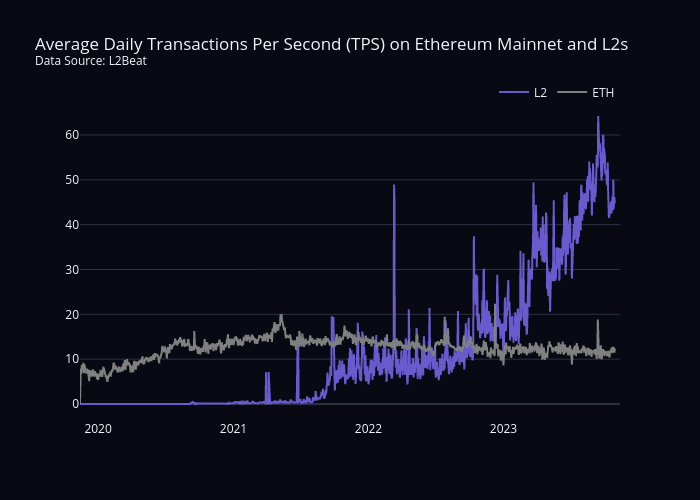
Sean_mjl's interactive graph and data of "Average Daily Transactions Per Second (TPS) on Ethereum Mainnet and L2sData Source: L2Beat" is a scatter chart, showing L2 vs ETH. The x-axis shows values from 2019-11-13T00:00:00 to 2023-11-12T00:00:00. The y-axis shows values from 0 to 0.