Edit chart
Loading graph
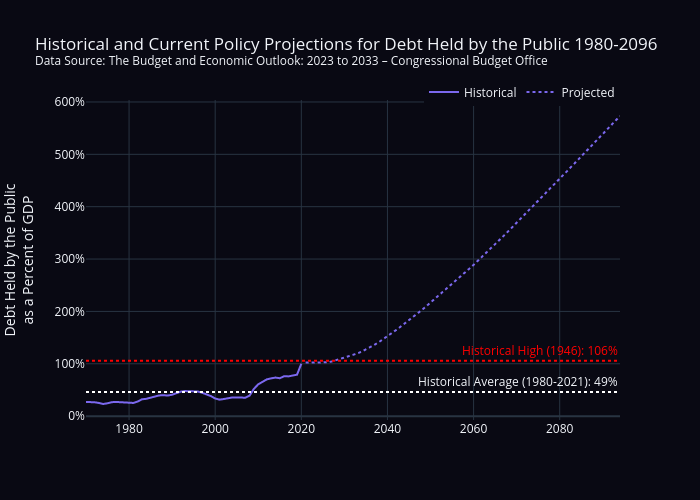
Sean_mjl's interactive graph and data of "Historical and Current Policy Projections for Debt Held by the Public 1980-2096Data Source: The Budget and Economic Outlook: 2023 to 2033 – Congressional Budget Office" is a line chart, showing Historical vs Projected; with Debt Held by the Publicas a Percent of GDP in the y-axis. The x-axis shows values from 0 to 0. The y-axis shows values from 0 to 0. This visualization has the following annotations: Historical Average (1980-2021): 49%; Historical High (1946): 106%