Edit chart
Loading graph
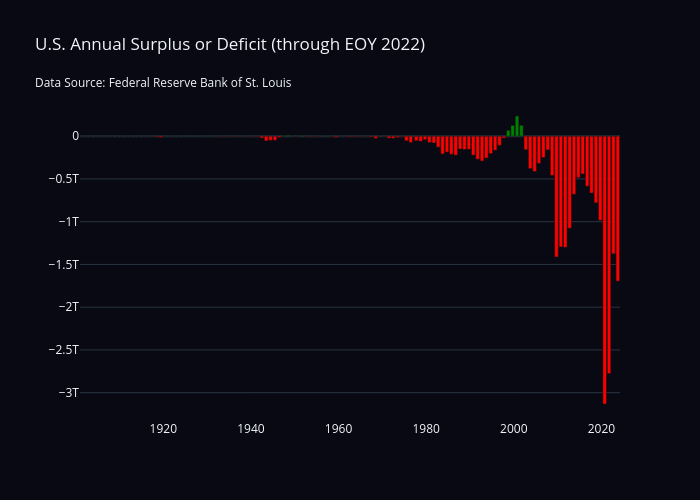
Sean_mjl's interactive graph and data of "U.S. Annual Surplus or Deficit (through EOY 2022)Data Source: Federal Reserve Bank of St. Louis" is a bar chart. The x-axis shows values from 0 to 0. The y-axis shows values from 0 to 0.