Edit chart
Loading graph
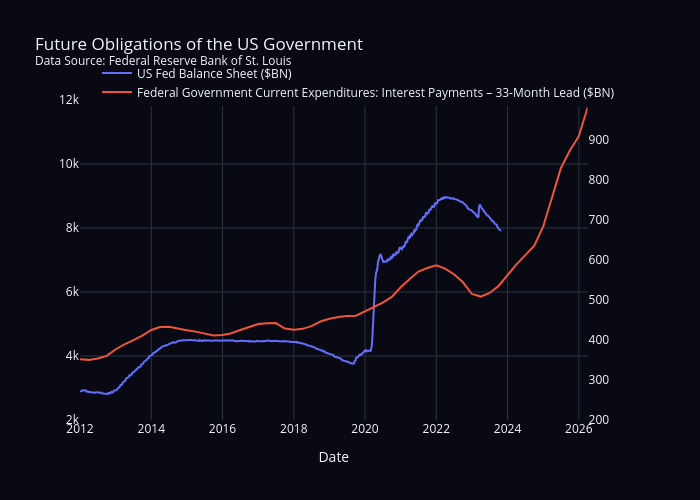
Sean_mjl's interactive graph and data of "Future Obligations of the US GovernmentData Source: Federal Reserve Bank of St. Louis" is a line chart, showing US Fed Balance Sheet ($BN) vs Federal Government Current Expenditures: Interest Payments – 33-Month Lead ($BN); with Date in the x-axis. The x-axis shows values from 0 to 0. The y-axis shows values from 2000 to 12000.