Edit chart
Loading graph
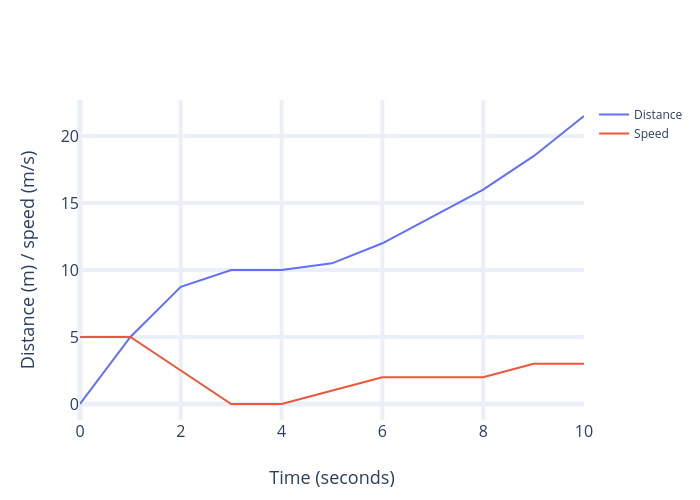
Sciteacherpd's interactive graph and data of "Distance (m) / speed (m/s) vs Time (seconds)" is a line chart, showing Distance vs Speed; with Time (seconds) in the x-axis and Distance (m) / speed (m/s) in the y-axis.. The x-axis shows values from 0 to 10. The y-axis shows values from -1.1944444444444444 to 22.694444444444443.