Edit chart
Loading graph
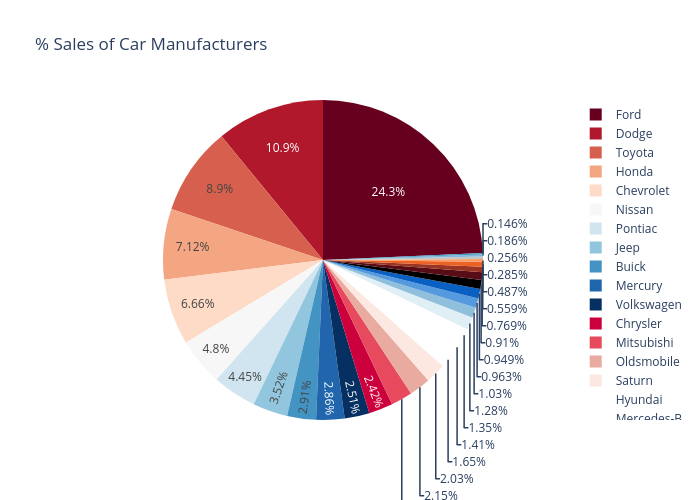
Satyabrata_sanrachna's interactive graph and data of "% Sales of Car Manufacturers" is a pie. The x-axis shows values from -1 to 6. The y-axis shows values from -1 to 4.