Edit chart
Loading graph
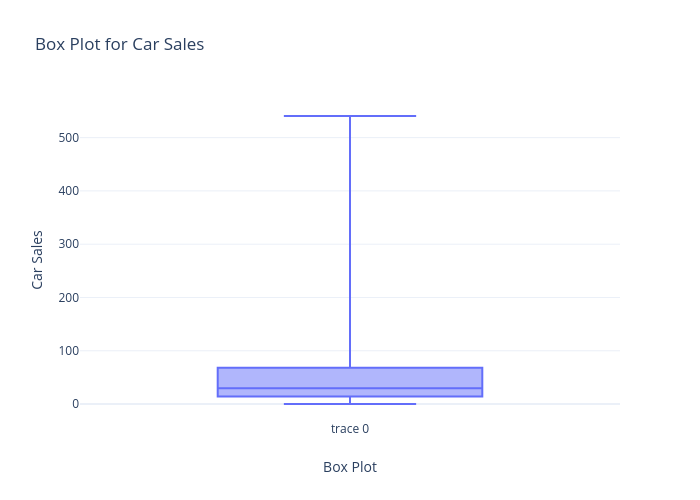
Satyabrata_sanrachna's interactive graph and data of "Box Plot for Car Sales" is a box plot; with Box Plot in the x-axis and Car Sales in the y-axis.. The x-axis shows values from -0.5 to 0.5. The y-axis shows values from -29.915055555555554 to 570.5860555555556.