Edit chart
Loading graph
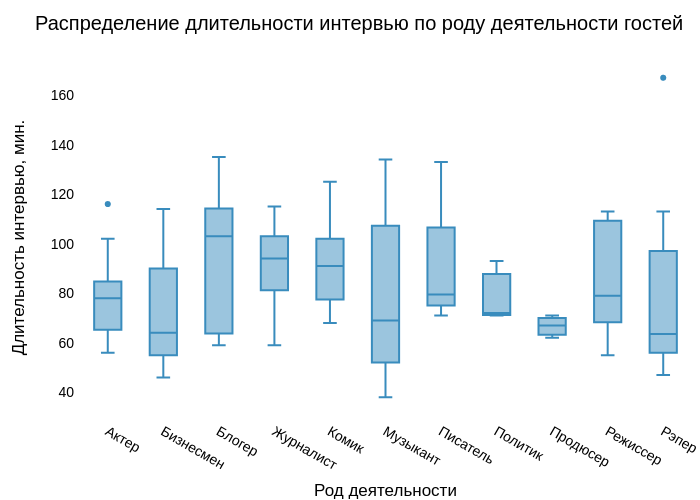
Satiukov.e's interactive graph and data of "Распределение длительности интервью по роду деятельности гостей" is a box plot; with Род деятельности in the x-axis and Длительность интервью, мин. in the y-axis.. The x-axis shows values from 0 to 0. The y-axis shows values from 0 to 0.