Edit chart
Loading graph
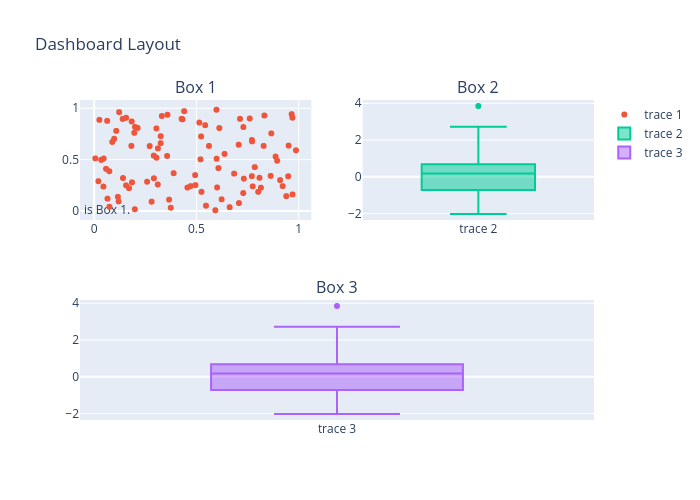
Sassmit's interactive graph and data of "Dashboard Layout" is a . The x-axis shows values from 0 to 0. The y-axis shows values from 0 to 0. This visualization has the following annotations: Box 1; Box 2; Box 3