Edit chart
Loading graph
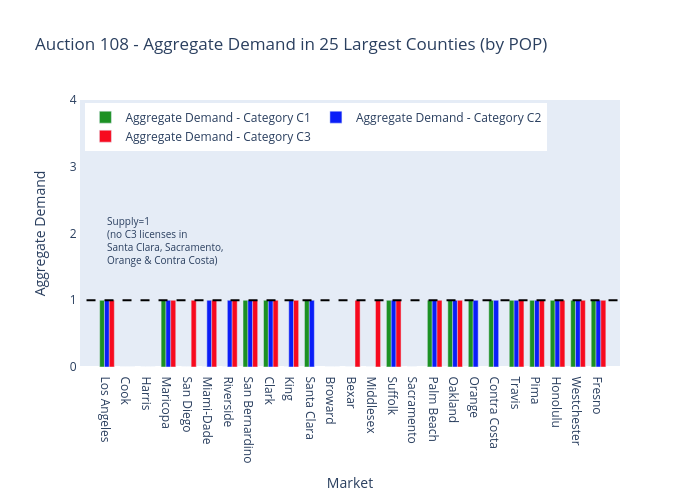
Sashajavid's interactive graph and data of "Auction 108 - Aggregate Demand in 25 Largest Counties (by POP)" is a grouped bar chart, showing Aggregate Demand - Category C1, Aggregate Demand - Category C2, Aggregate Demand - Category C3, Supply; with Market in the x-axis and Aggregate Demand in the y-axis.. The x-axis shows values from 0 to 0. The y-axis shows values from 0 to 4.