Edit chart
Loading graph
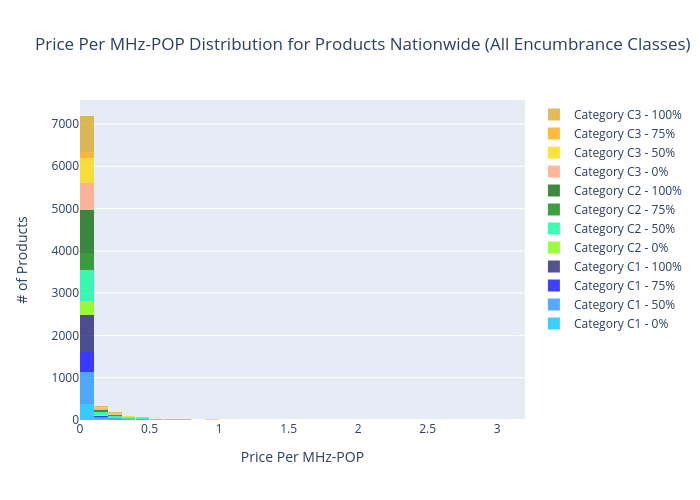
Sashajavid's interactive graph and data of "Price Per MHz-POP Distribution for Products Nationwide (All Encumbrance Classes)" is a histogram, showing Category C1 - 0%, Category C1 - 50%, Category C1 - 75%, Category C1 - 100%, Category C2 - 0%, Category C2 - 50%, Category C2 - 75%, Category C2 - 100%, Category C3 - 0%, Category C3 - 50%, Category C3 - 75%, Category C3 - 100%; with Price Per MHz-POP in the x-axis and # of Products in the y-axis.. The x-axis shows values from 0 to 0. The y-axis shows values from 0 to 0.