Edit chart
Loading graph
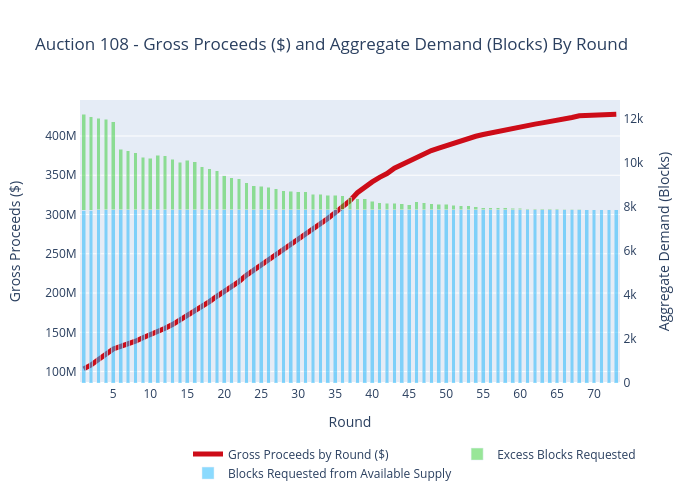
Sashajavid's interactive graph and data of "Auction 108 - Gross Proceeds ($) and Aggregate Demand (Blocks) By Round" is a stacked bar chart, showing Blocks Requested from Available Supply, Excess Blocks Requested, Gross Proceeds by Round ($); with Round in the x-axis and Gross Proceeds ($) in the y-axis.. The x-axis shows values from 0 to 0. The y-axis shows values from 0 to 0.