Edit chart
Loading graph
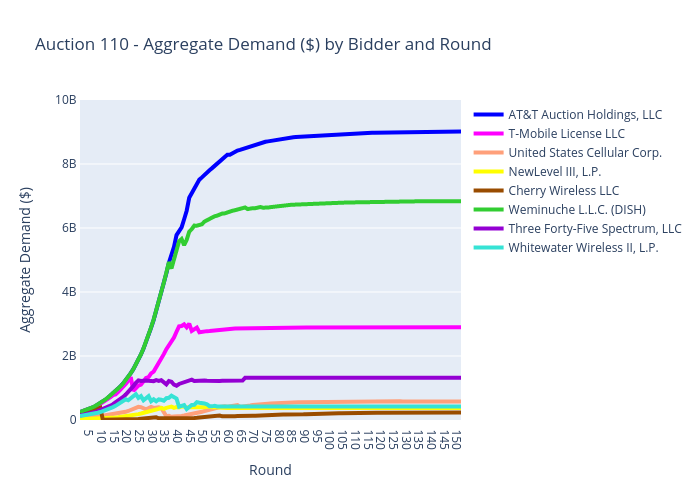
Sashajavid's interactive graph and data of "Auction 110 - Aggregate Demand ($) by Bidder and Round" is a scatter chart, showing Cellco Partnership (Verizon), AT&T Auction Holdings, LLC, T-Mobile License LLC, United States Cellular Corp., NewLevel III, L.P., Cherry Wireless LLC, Weminuche L.L.C. (DISH), Three Forty-Five Spectrum, LLC, Whitewater Wireless II, L.P.; with Round in the x-axis and Aggregate Demand ($) in the y-axis.. The x-axis shows values from 0 to 0. The y-axis shows values from 0 to 10000000000.