Edit chart
Loading graph
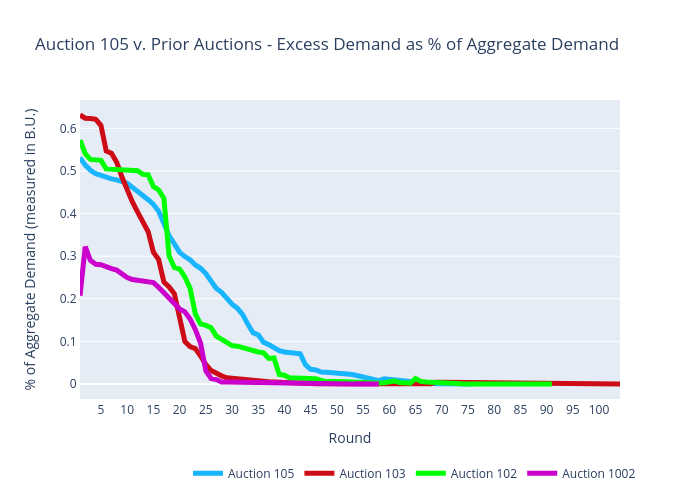
Sashajavid's interactive graph and data of "Auction 105 v. Prior Auctions - Excess Demand as % of Aggregate Demand" is a scatter chart, showing Auction 105, Auction 103, Auction 102, Auction 1002; with Round in the x-axis and % of Aggregate Demand (measured in B.U.) in the y-axis.. The x-axis shows values from 0 to 0. The y-axis shows values from 0 to 0.