Edit chart
Loading graph
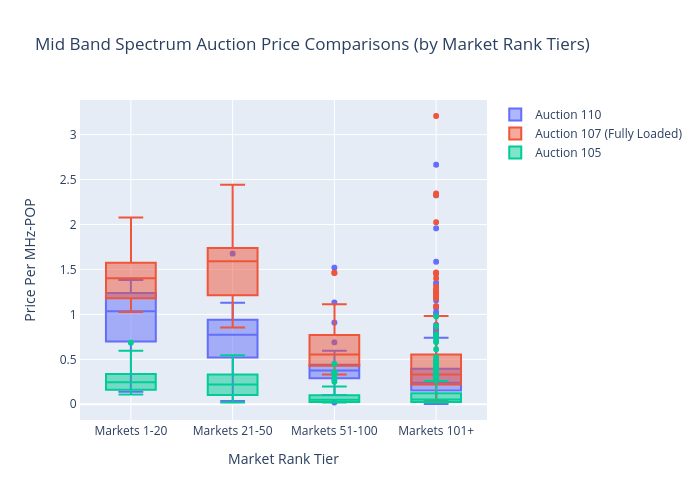
Sashajavid's interactive graph and data of "Mid Band Spectrum Auction Price Comparisons (by Market Rank Tiers)" is a box plot, showing Auction 110, Auction 107 (Fully Loaded), Auction 105; with Market Rank Tier in the x-axis and Price Per MHz-POP in the y-axis.. The x-axis shows values from 0 to 0. The y-axis shows values from 0 to 0.