Edit chart
Loading graph
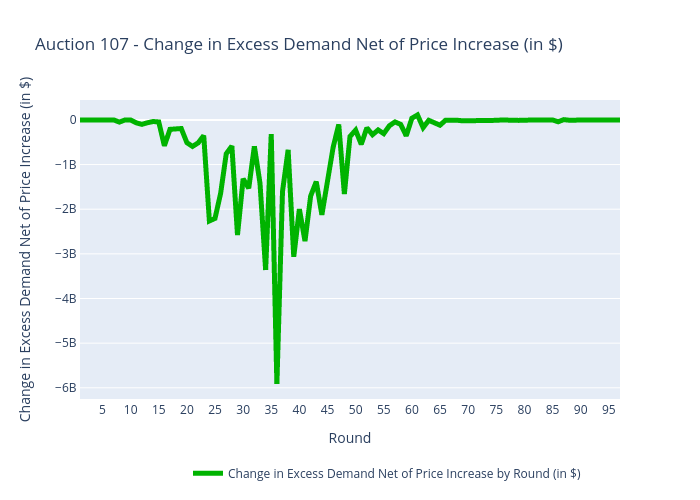
Sashajavid's interactive graph and data of "Auction 107 - Change in Excess Demand Net of Price Increase (in $) " is a scatter chart, showing Change in Excess Demand Net of Price Increase by Round (in $); with Round in the x-axis and Change in Excess Demand Net of Price Increase (in $) in the y-axis.. The x-axis shows values from 0 to 0. The y-axis shows values from 0 to 0.