Edit chart
Loading graph
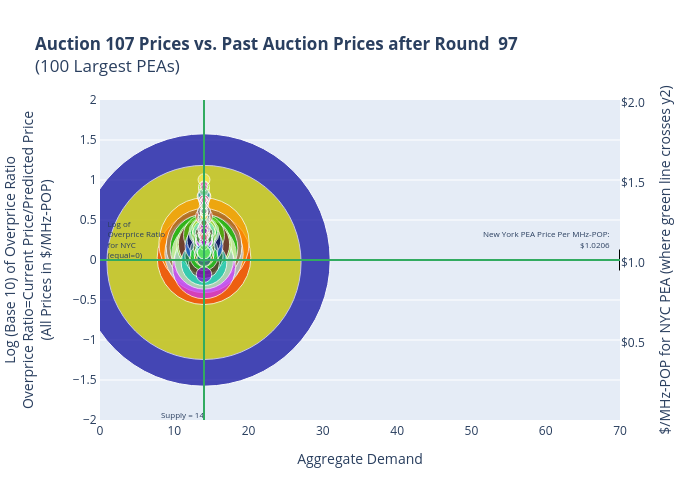
Sashajavid's interactive graph and data of "Auction 107 Prices vs. Past Auction Prices after Round 97(100 Largest PEAs)" is a scatter chart, showing Auction 107, Auction 107, Supply; with Aggregate Demand in the x-axis and Log (Base 10) of Overprice RatioOverprice Ratio=Current Price/Predicted Price(All Prices in $/MHz-POP) in the y-axis.. The x-axis shows values from 0 to 70. The y-axis shows values from -2 to 2.