Edit chart
Loading graph
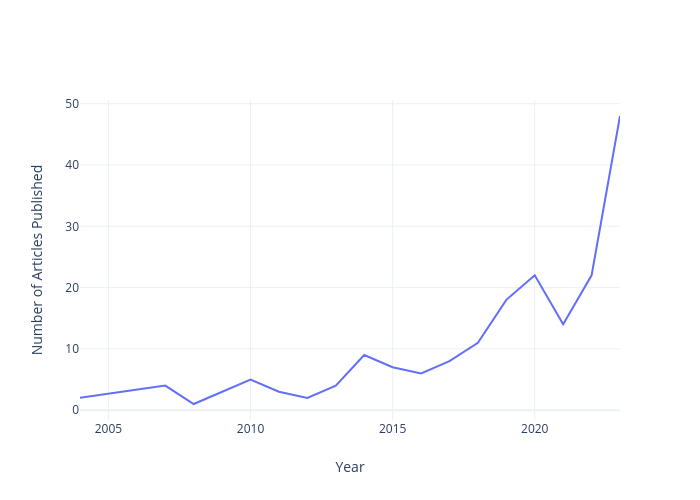
Santoshmalkoti's interactive graph and data of "Number of Articles Published vs Year" is a line chart; with Year in the x-axis and Number of Articles Published in the y-axis.. The x-axis shows values from 2004 to 2023. The y-axis shows values from -1.6111111111111107 to 50.611111111111114.