Edit chart
Loading graph
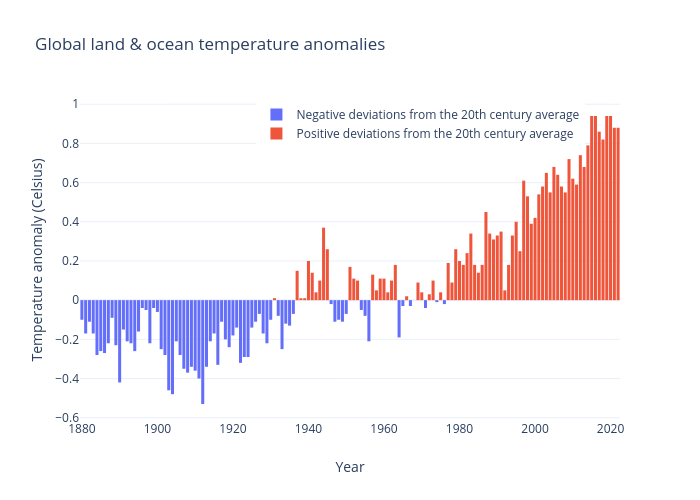
Sajeewasp's interactive graph and data of "Global land & ocean temperature anomalies" is a bar chart, showing Negative deviations from the 20th century average vs Positive deviations from the 20th century average; with Year in the x-axis and Temperature anomaly (Celsius) in the y-axis.. The x-axis shows values from 1879.5 to 2022.5. The y-axis shows values from -0.6116666666666667 to 1.0216666666666667.