Edit chart
Loading graph
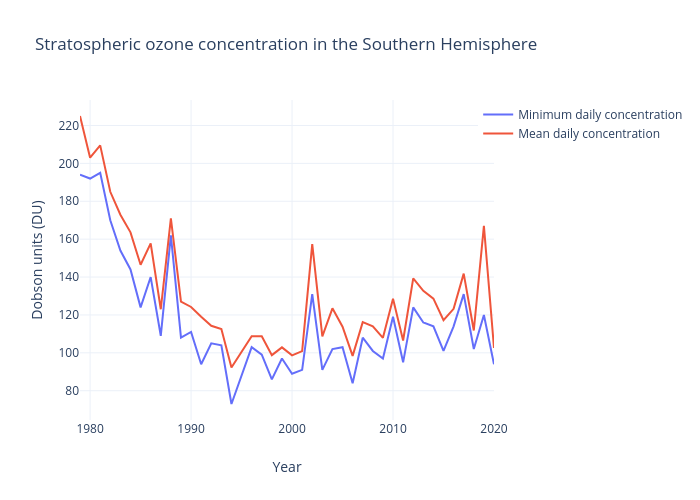
Sajeewasp's interactive graph and data of "Stratospheric ozone concentration in the Southern Hemisphere" is a line chart, showing Minimum daily concentration vs Mean daily concentration; with Year in the x-axis and Dobson units (DU) in the y-axis.. The x-axis shows values from 1979 to 2020. The y-axis shows values from 64.55555555555556 to 233.44444444444446.