Edit chart
Loading graph
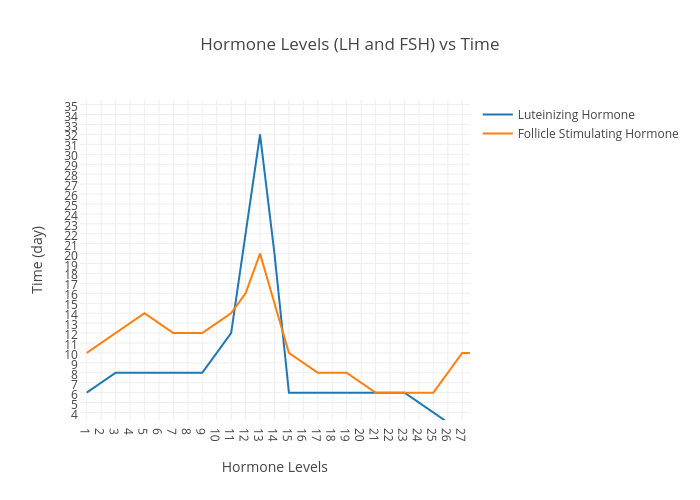
Safwanislam's interactive graph and data of "Hormone Levels (LH and FSH) vs Time" is a scatter chart, showing Luteinizing Hormone vs Follicle Stimulating Hormone ; with Hormone Levels in the x-axis and Time (day) in the y-axis.. The x-axis shows values from 0.5366379394145451 to 27.536637939414533. The y-axis shows values from 3.2447964531324693 to 35.46701867535467.