Edit chart
Loading graph
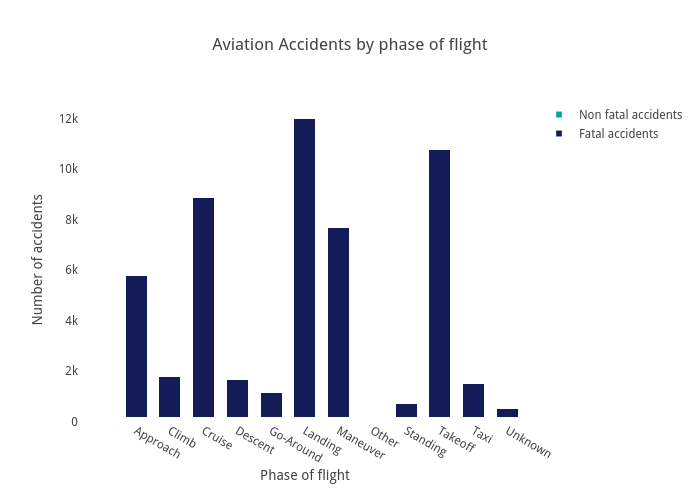
S3370523's interactive graph and data of "Aviation Accidents by phase of flight" is a stacked bar chart, showing Fatal accidents vs Non fatal accidents; with Phase of flight in the x-axis and Number of accidents in the y-axis.. The x-axis shows values from 0.5 to 12.5. The y-axis shows values from 0 to 19477.894736842107.