Edit chart
Loading graph
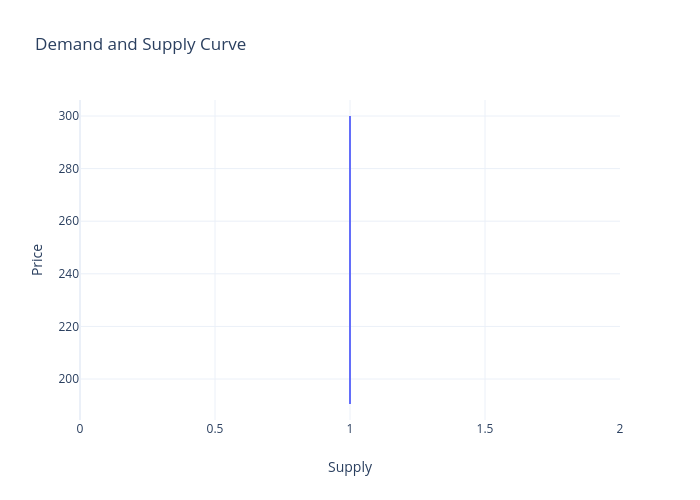
Rudranshmukherjee's interactive graph and data of "Demand and Supply Curve" is a line chart; with Supply in the x-axis and Price in the y-axis.. The x-axis shows values from 0 to 2. The y-axis shows values from 184.41666666666666 to 306.0833333333333.