Edit chart
Loading graph
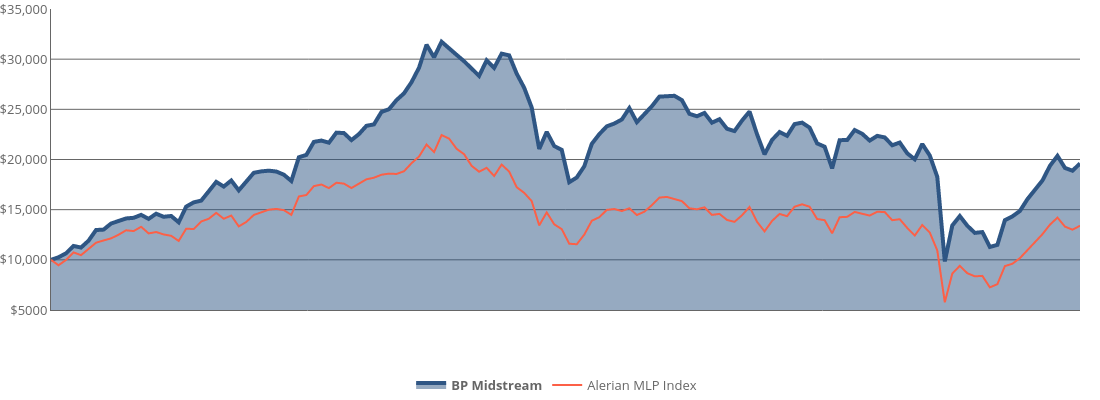
Rthibode's interactive graph and data of "" is a filled line chart, showing BP Midstream vs Alerian MLP Index. The x-axis shows values from 0 to 135. The y-axis shows values from 5000 to 35000.