Edit chart
Loading graph
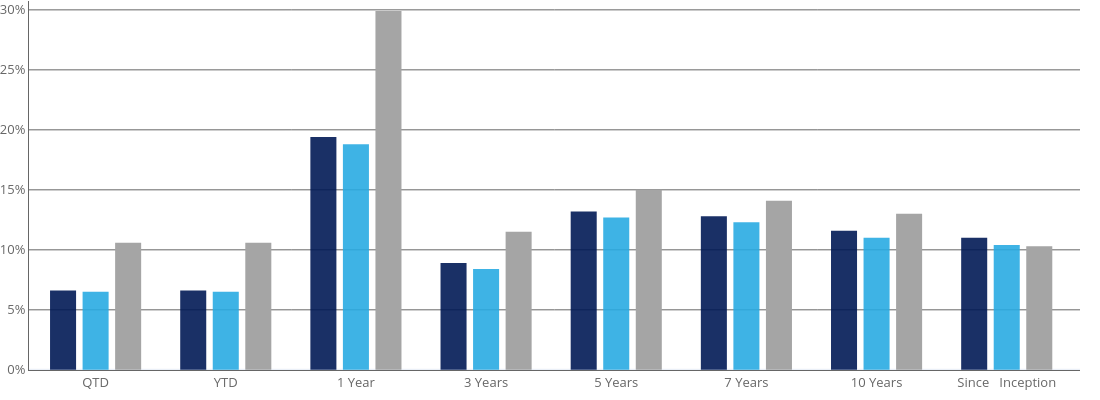
Rthibode's interactive graph and data of "" is a grouped bar chart, showing Brentview (Gross), Brentview (Net), S&P 500 Dividend Aristocrats. The x-axis shows values from -0.5116830767581216 to 7.562921803265789. The y-axis shows values from -0.015837957962336446 to 30.738406607307734.