Edit chart
Loading graph
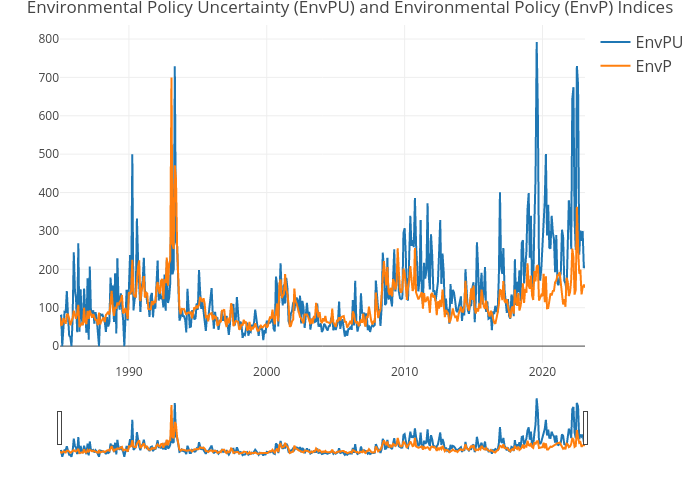
Rswartz1's interactive graph and data of "Environmental Policy Uncertainty (EnvPU) and Environmental Policy (EnvP) Indices" is a line chart, showing EnvPU vs EnvP; with [] in the x-axis. The x-axis shows values from 0 to 0. The y-axis shows values from 0 to 0.