Edit chart
Loading graph
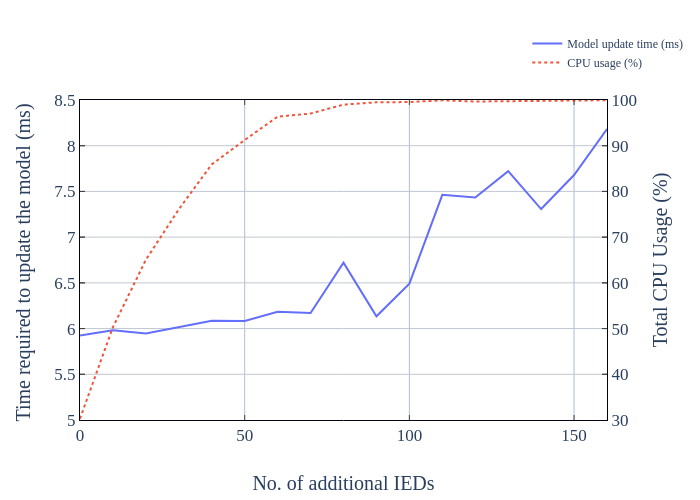
Roomi.s's interactive graph and data of "Time required to update the model (ms) vs No. of additional IEDs" is a line chart, showing Model update time (ms) vs CPU usage (%); with No. of additional IEDs in the x-axis and Time required to update the model (ms) in the y-axis.. The x-axis shows values from 0 to 160. The y-axis shows values from 5 to 8.5.