Edit chart
Loading graph
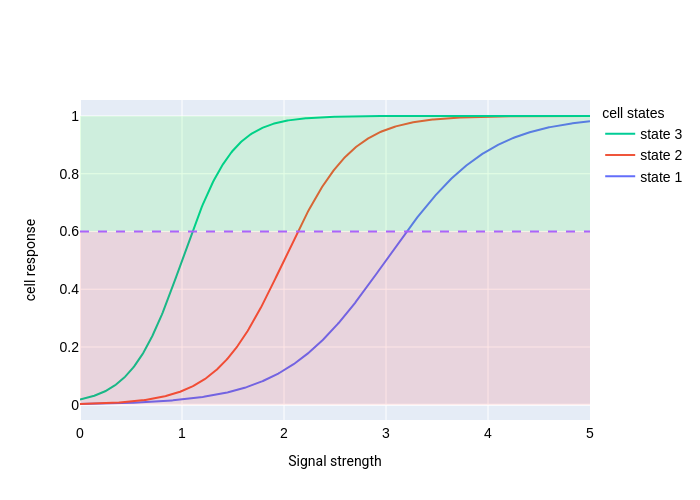
Ronmoran's interactive graph and data of "cell response vs Signal strength" is a line chart, showing state 1, state 2, state 3; with Signal strength in the x-axis and cell response in the y-axis.. The x-axis shows values from 0 to 5. The y-axis shows values from -0.05294556444577441 to 1.0554181876024091.