Edit chart
Loading graph
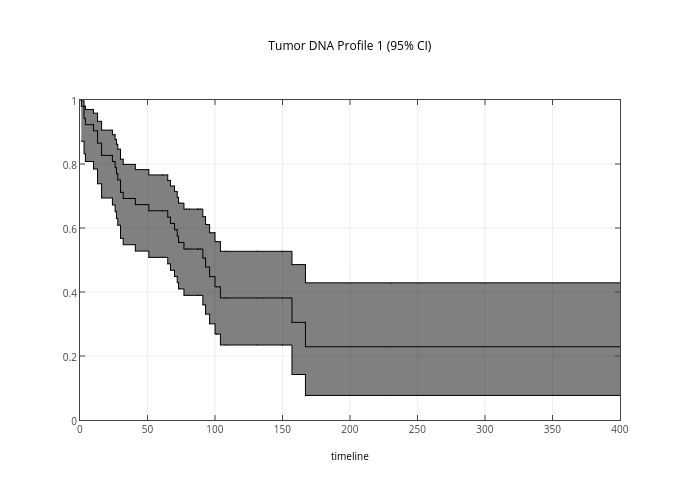
Rmdk's interactive graph and data of "Tumor DNA Profile 1 (95% CI)" is a line chart, showing KM_estimate, KM_estimate_upper_0.95, KM_estimate_lower_0.95. The x-axis shows values from 0 to 0. The y-axis shows values from 0 to 0.