Edit chart
Loading graph
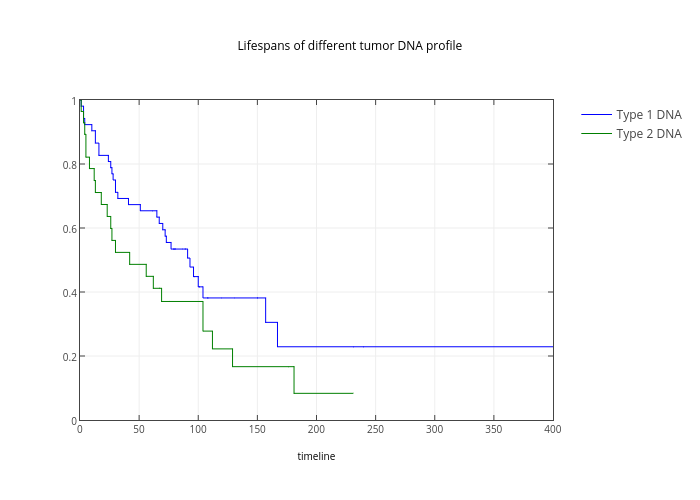
Rmdk's interactive graph and data of "Lifespans of different tumor DNA profile" is a line chart, showing Type 1 DNA vs Type 2 DNA. The x-axis shows values from 0 to 0. The y-axis shows values from 0 to 0.