Edit chart
Loading graph
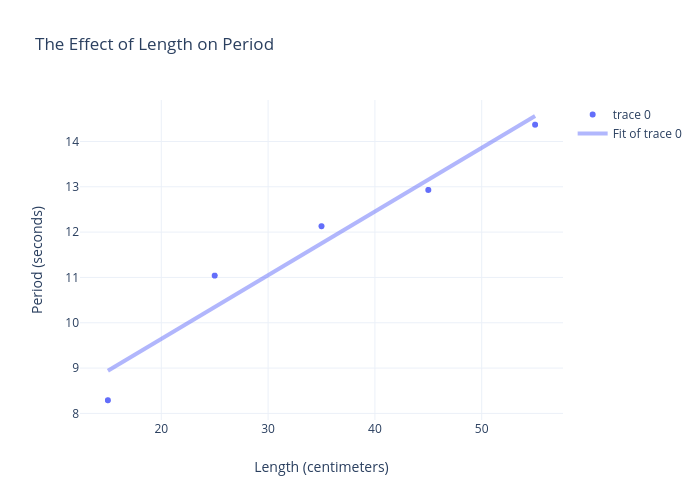
Rguiry200's interactive graph and data of "The Effect of Length on Period" is a scatter chart; with Length (centimeters) in the x-axis and Period (seconds) in the y-axis.. The x-axis shows values from 12.25563909774436 to 57.744360902255636. The y-axis shows values from 7.861093177766962 to 14.914679306433491.