Edit chart
Loading graph
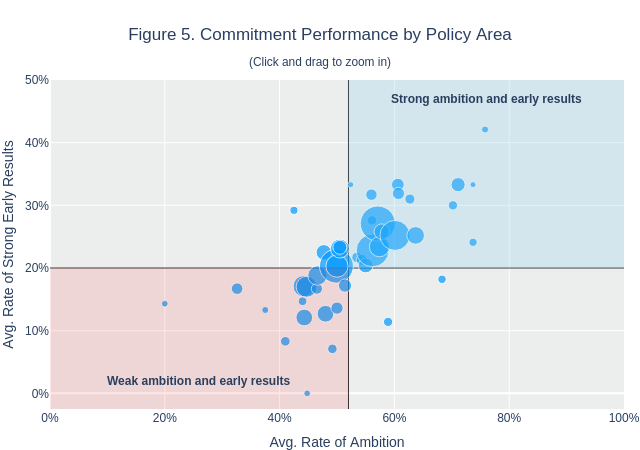
Rfalla's interactive graph and data of "Figure 5. Commitment Performance by Policy Area(Click and drag to zoom in)" is a line chart, showing Global Average: Ambition, Global Average: Early Results, Policy Area; with Avg. Rate of Ambition in the x-axis and Avg. Rate of Strong Early Results in the y-axis.. The x-axis shows values from 0 to 1. The y-axis shows values from -0.025 to 0.5. This visualization has the following annotations: Strong ambition and early results; Weak ambition and early results