Edit chart
Loading graph
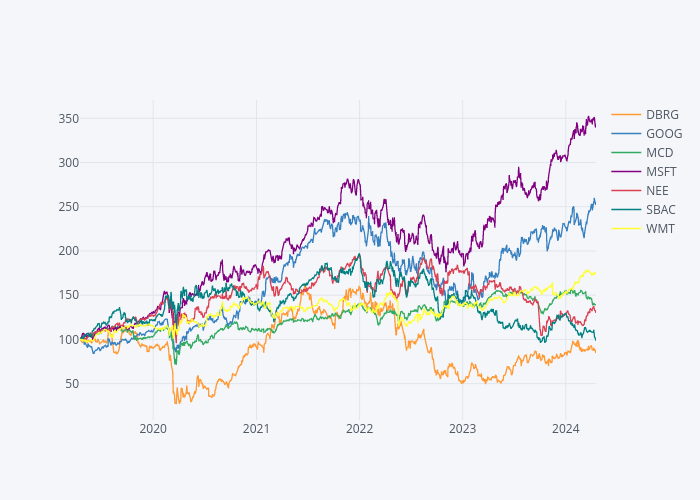
Resteves58's interactive graph and data of "{'font': {'color': '#4D5663'}}" is a line chart, showing DBRG, GOOG, MCD, MSFT, NEE, SBAC, WMT. The x-axis shows values from 0 to 0. The y-axis shows values from 0 to 0.