Edit chart
Loading graph
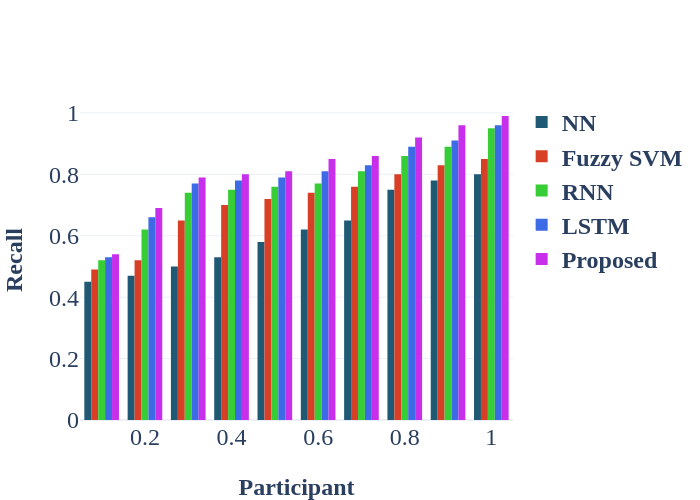
Researchsoundaryas's interactive graph and data of "Recall vs Participant" is a bar chart, showing NN, Fuzzy SVM, RNN, LSTM, Proposed; with Participant in the x-axis and Recall in the y-axis.. The x-axis shows values from 0.05000000000000002 to 1.05. The y-axis shows values from 0 to 1.0421052631578946.