Edit chart
Loading graph
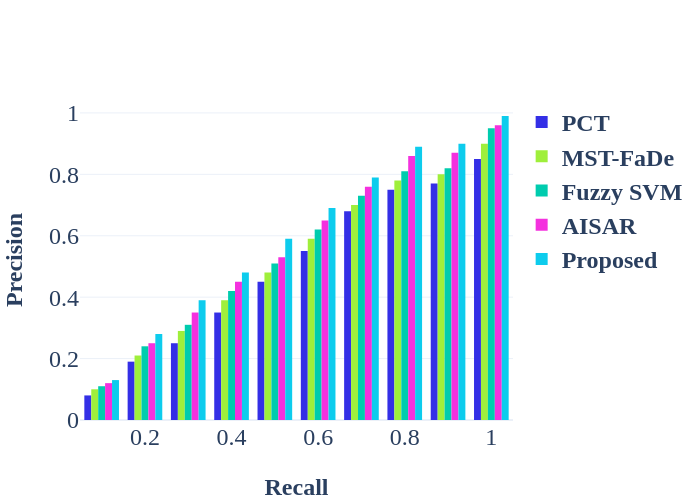
Researchsoundaryas's interactive graph and data of "{'font': {'size': 24}}" is a bar chart, showing PCT, MST-FaDe, Fuzzy SVM, AISAR, Proposed; with Recall in the x-axis and Precision in the y-axis.. The x-axis shows values from 0.05000000000000002 to 1.05. The y-axis shows values from 0 to 1.0421052631578946.