Edit chart
Loading graph
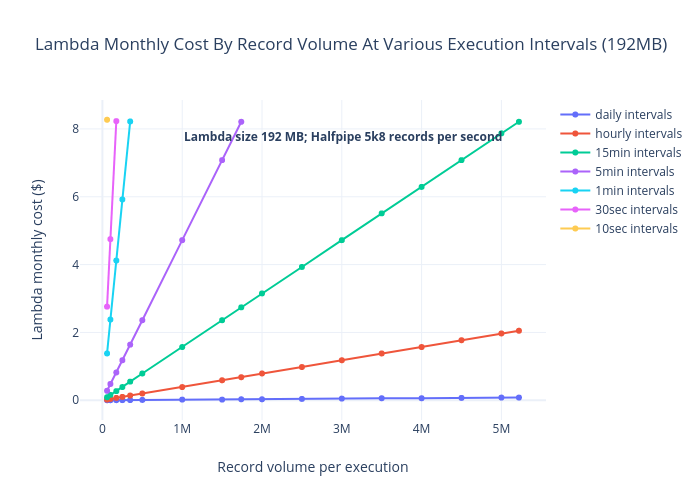
Relloyd's interactive graph and data of "Lambda Monthly Cost By Record Volume At Various Execution Intervals (192MB)" is a , showing daily intervals, hourly intervals, 15min intervals, 5min intervals, 1min intervals, 30sec intervals, 10sec intervals; with Record volume per execution in the x-axis and Lambda monthly cost ($) in the y-axis.. The x-axis shows values from -244031.91489361704 to 5522031.914893617. The y-axis shows values from -0.5102152527075813 to 8.78121525270758. This visualization has the following annotation: Lambda size 192 MB; Halfpipe 5k8 records per second