Edit chart
Loading graph
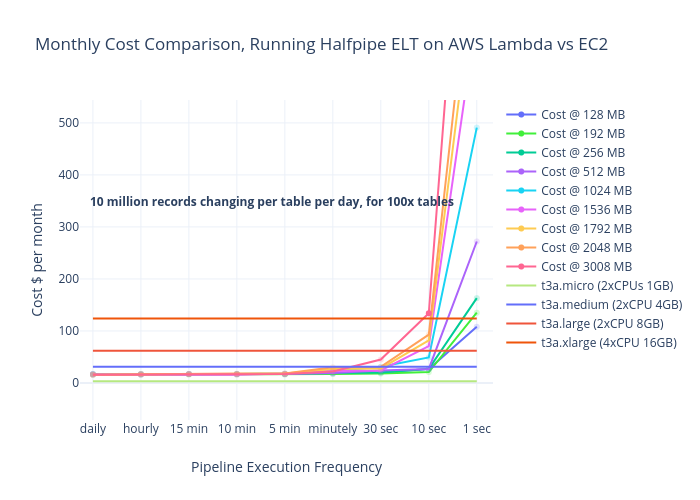
Relloyd's interactive graph and data of "Monthly Cost Comparison, Running Halfpipe ELT on AWS Lambda vs EC2" is a , showing Cost @ 128 MB, Cost @ 192 MB, Cost @ 256 MB, Cost @ 512 MB, Cost @ 1024 MB, Cost @ 1536 MB, Cost @ 1792 MB, Cost @ 2048 MB, Cost @ 3008 MB, t3a.micro (2xCPUs 1GB), t3a.medium (2xCPU 4GB), t3a.large (2xCPU 8GB), t3a.xlarge (4xCPU 16GB); with Pipeline Execution Frequency in the x-axis and Cost $ per month in the y-axis.. The x-axis shows values from 8.269414795730585 to -0.3381180223285494. The y-axis shows values from -71.22059331476324 to 544.0345459610028. This visualization has the following annotation: 10 million records changing per table per day, for 100x tables