Edit chart
Loading graph
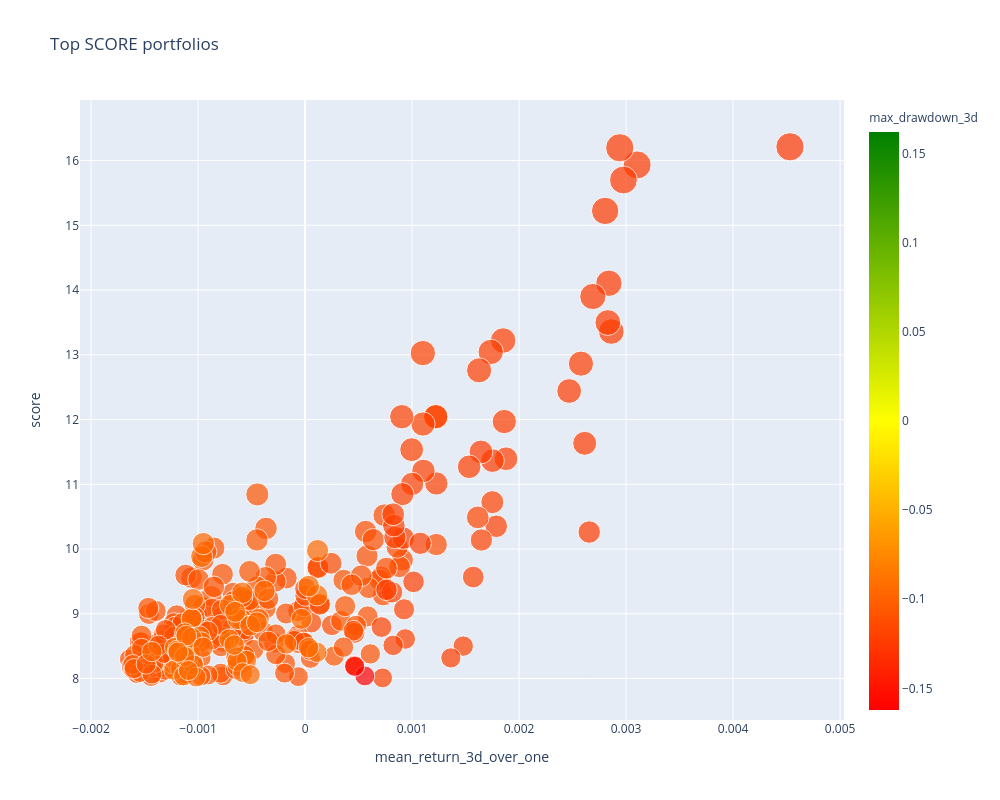
Realmistic's interactive graph and data of "Top SCORE portfolios" is a scatter chart; with mean_return_3d_over_one in the x-axis and score in the y-axis.. The x-axis shows values from 0 to 0. The y-axis shows values from 0 to 0.