Edit chart
Loading graph
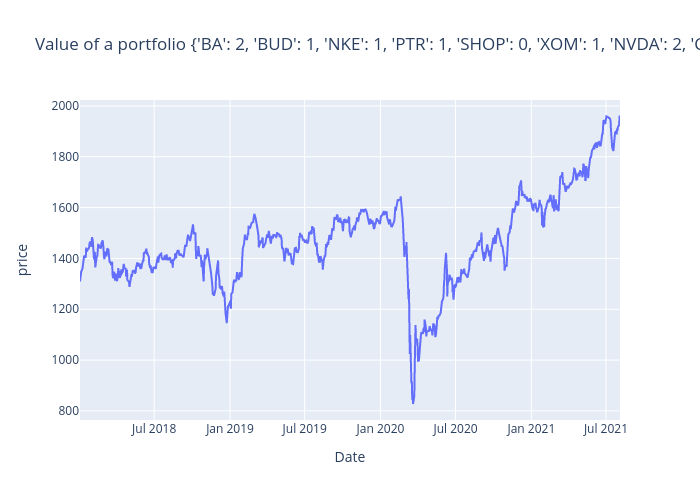
Realmistic's interactive graph and data of "Value of a portfolio {'BA': 2, 'BUD': 1, 'NKE': 1, 'PTR': 1, 'SHOP': 0, 'XOM': 1, 'NVDA': 2, 'CHTR': 1} over time -- DYNAMIC" is a line chart; with Date in the x-axis and price in the y-axis.. The x-axis shows values from 0 to 0. The y-axis shows values from 0 to 0.