Edit chart
Loading graph
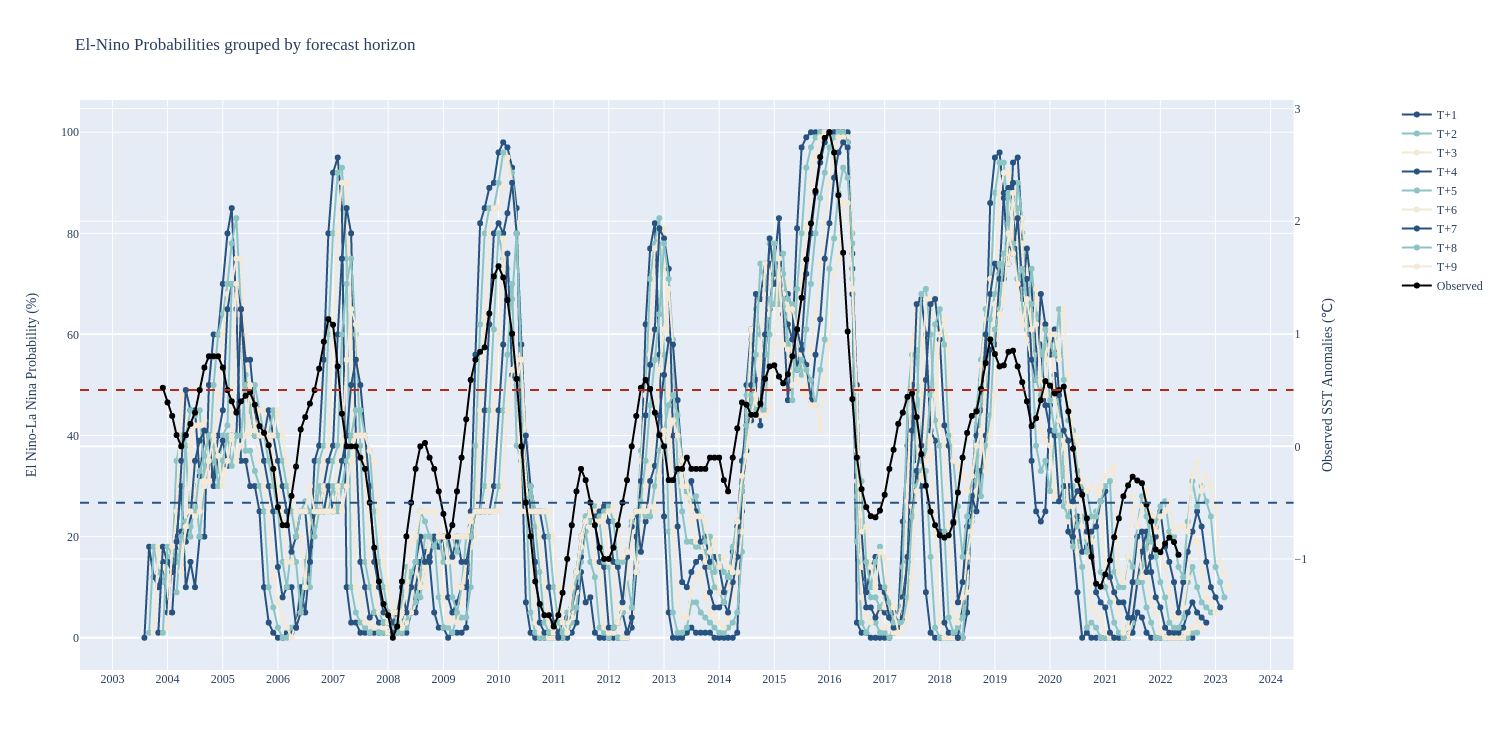
Raycstoic's interactive graph and data of "El-Nino Probabilities grouped by forecast horizon" is a line chart, showing T+1, T+2, T+3, T+4, T+5, T+6, T+7, T+8, T+9, Observed; with El Nino-La Nina Probability (%) in the y-axis. The x-axis shows values from 0 to 0. The y-axis shows values from 0 to 0.